Sentiment Analysis
Finally for our project, we are interested in understanding which hotels were given the most positive reviews and which hotels were performing poorest. Since there is a large set of reviews written by independent users, we can suggest that, by performing sentiment analysis upon the aggregated reviews for each hotel in part, we will be able to find the best hotels in Las Vegas.
Our sentiment analysis is dependent on an initial set of words which have sentiment scoring, used for comparing back to the words found in our reviews.
This happens to be one of major researches of Prof. Finn Årup Nielsen, researcher at DTU Compute, which created the AFINN dataset. AFINN is a list of words rated for sentimental valence, and scored on an integer scale between -5 (negative) and 5 (positive). Therefore, a completely neutral word or sentence would have a score of 0. This dataset has been updated several times throughout the years, with the latest update being in 2015. This is the dataset which we are using.
Below is a snippet of what the AFINN-165 dataset looks like.
| word | sentiment_score | |
|---|---|---|
| 0 | abandons | -2 |
| 1 | abducted | -2 |
| 2 | abduction | -2 |
| 3 | abductions | -2 |
| 4 | abhor | -3 |
| ... | ... | ... |
| 3375 | yucky | -2 |
| 3376 | yummy | 3 |
| 3377 | zealot | -2 |
| 3378 | zealots | -2 |
| 3379 | zealous | 2 |
3380 rows × 2 columns
The following steps have been conducted to compute sentiment score of each business or community
Extract words from reviews
Remove stopwords to minimize the influence of the most common words (which often do not indicate emotional feelings on purpose)
Use AFINN-165 sentiment score dictionary (as reference) to obtain the sentiment score of each word
Sum up the sentiment scores of each word shown in the review text and compute the average sentiment by dividing the number of words
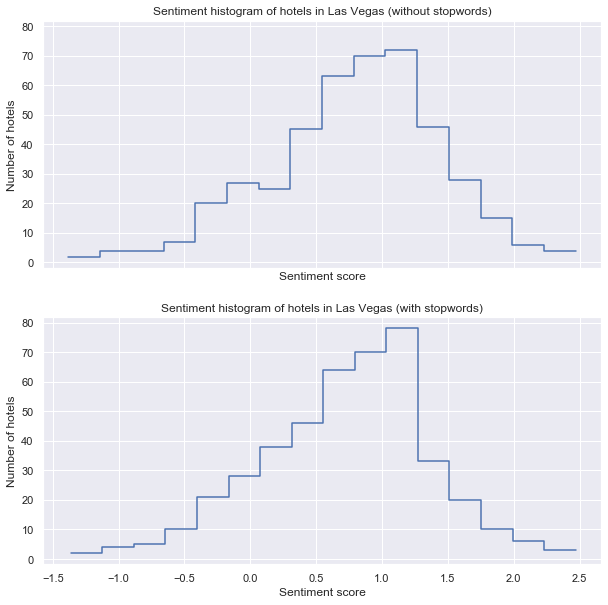
We will plot the histogram of scores with and without stopwords, across all the hotels in Las Vegas.
The “best” and “worst” Hotels
Best 10
#1 Roberta's Steakhouse - Sentiment: 2.471, Rating: 4.5
#2 Team Kaizen - Sentiment: 2.303, Rating: 5.0
#3 Sands Hotel - Sentiment: 2.25, Rating: 4.5
#4 Fortunes - Sentiment: 2.2, Rating: 3.5
#5 Jennifer Romas' Sexxy - Sentiment: 2.087, Rating: 4.5
#6 Star Motel - Sentiment: 2.067, Rating: 4.5
#7 Lip Smacking Foodie Tours - Sentiment: 2.053, Rating: 5.0
#8 Venetian Casino Grazie Club Gold Room - Sentiment: 2.033, Rating: 4.0
#9 Las Vegas Strip Trips - Sentiment: 2.027, Rating: 5.0
#10 HGVClub - Sentiment: 1.941, Rating: 4.5
Worst 10
#1 Exotic Escapes - Sentiment: -1.364, Rating: 1.0
#2 Umpire - Sentiment: -1.222, Rating: 1.0
#3 Siegel Suites - Sentiment: -1.091, Rating: 2.0
#4 Las Vegas Villa - Sentiment: -0.962, Rating: 2.0
#5 Holiday Motel - Sentiment: -0.926, Rating: 1.5
#6 Desert Star Motel - Sentiment: -0.907, Rating: 1.5
#7 Holiday House Holiday Motel - Sentiment: -0.741, Rating: 2.0
#8 Lamplighter Motel - Sentiment: -0.72, Rating: 1.0
#9 Siegel Suites Bonanza - Sentiment: -0.706, Rating: 1.0
#10 Sahara Westwood Hotel - Sentiment: -0.697, Rating: 1.0
Temporal sentiment geomapping
Now that we have identified the general sentiment trends across our Yelp Hotels dataset, it is important to also link these sentiments to the geo-temporal dimension that our dataset comes from. In other words, we know that each hotel is located at a specific (latitude, longitude) location, and that every review has been written at a certain date and hour in time.
We will use these two dimensions to analyze an interactive geo-map, where we position the hotels according to their location on the map, and their sentiment scores in the time domain will dictate the color of their node.
The following two cases are considered:
Seasonal temporal map, where we will check if sentiment scores change based on the year quarter (e.g. Q1 - January to March, etc.) in which they were written;
Time-of-day temporal map, where we will check the trend of sentiment scores across the 5 different times of day during which they were written (morning, noon, afternoon, evening, night);
Geomap of the overall sentiment score
This first geomap is showing the overall sentiments across each hotel in Las Vegas. This visualization does not take into account any temporal domain separation, and is included as a baseline reference of how the Las Vegas landscape looks like, in terms of sentiment analysis.
As we can see, most hotels have a slighly positive experience rating, with the ones in the center of the city being more inclined to have a better overall score, while the perifery of the city shows some hotels with a rather neutral outlook.
Seasonal temporal map (based on yearly quarters)
For our second geomap, we will compute sentiment scores of businesses in each quarter of year, to see if there is any variation between seasons. Based on the segmentation of time, now it is possible to compute the sentiment score for every hotel during each time-period:
Based on the interactive plotly visualization above, we can identify that most positive sentiment scores are given in Q1 of the year, meaning in the months between January & March (inclusive), while the lowest sentiment scores can be found from reviews written in the Q3 period of the year (meaning in the months of July, August & September).
It seems that this behavior is in connection with the both the higher tourist expectations, who generally arrive in the summer months, as well as the increased crime rate during the summertime (statistics found from US journalism house: report here).
Time-of-day temporal map
Our final geomap refers to the sentiment scores received by reviews, grouped by the time of day during which they were written. We are interested in seeing if there is any change between the different periods of a day during which a review is submitted. For that, we will again compute sentiment scores of businesses for each time of day individually, and use an interactive plotly visualization to show the differences in scores as changing node colors.
Through understanding the geomap above, we can clearly see that the least-positive reviews are written during the morning time (between 06:00 AM and 11:00 AM), with almost no hotel at all received an aggregated sentiment score above 1 (out of max. +5). In contrast, reviews written during the evening are the most positive, with aggregated sentiments for the same hotel crossing above the 1.00 score mark, and, for the best hotels, averaging around 1.7-1.8 in total. Reviews posted during the afternoon or nighttime seem to be more neutral than during the evening, however still manage to cross the borderline 0.00 score.
In general, this clearly shows a trend in the review-posting behavior of users, and by clicking the buttons of the visualization, one can get a quick overview that this trend is applicable across the vast majority of the hotels, making it a temporal trend effect (rather than localized behaviour of a specific hotel).