Network analysis
After we have determined the top 10 most relevant keywords for each business in part, these keywords are being used to define the connection between the hotels and the number of the common keywords determine the strengths of connections.
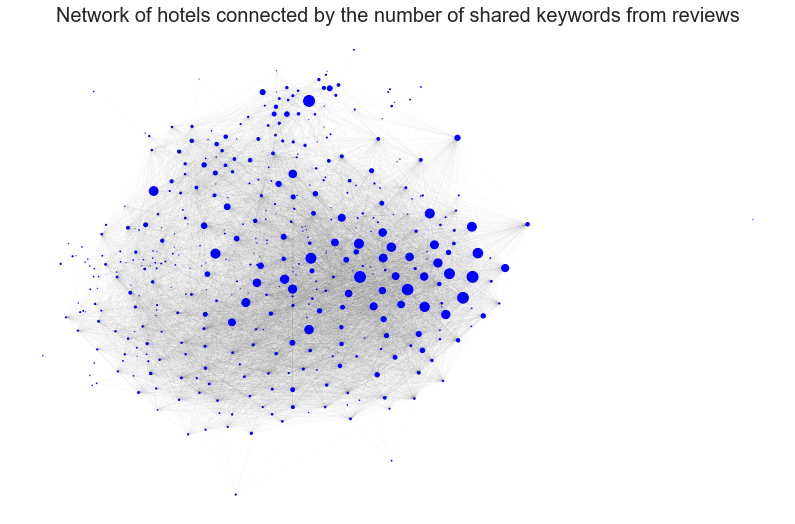
There are initially 438 hotels/nodes in the network, where 421 of them remains after removing the isolated nodes. We have found 10790 edges in the network.
The network plot
With Force Atlas
In order to visualize how the constructed graph looks like, we will use a force-directed layout for our graph, based on the Force Atlas algorithm, which computes node positions spatializing our undirected weighted graph.
Node sizes are calculated based on the total number of reviews that each hotel has, multiplied by a minimizing constant, so as to make the sizes reasonable to display. Therefore, very popular hotels will have larger node sizes than most others.
Interactive plot with Plotly
By hovering over the interactive graph, you will be able to find how many connections each hotel has with its neighbors/competitors. It can be clearly seen that the most popular nodes are also some of the ones with highest degree of connection, meaning that they share a larger number of competitors than most other businesses.
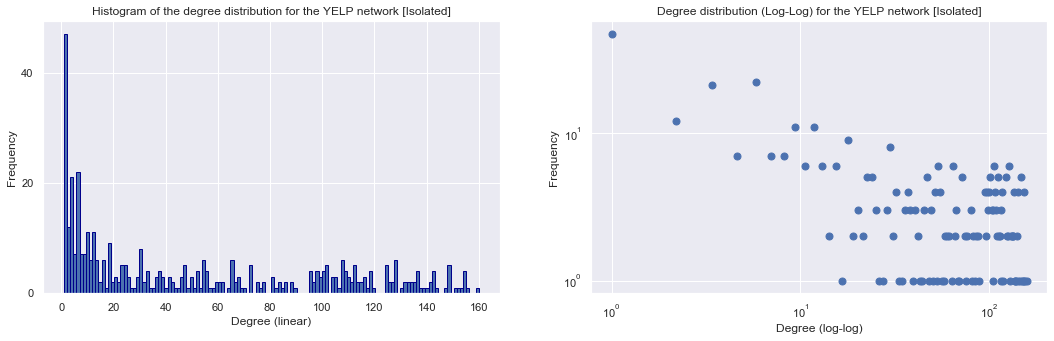
Degree distribution
To verify whether the assumption that the network follows Barabasi-Albert properties the linear and log-log degree distribution of the network are plotted, as done below.
The network edges are weight-adjusted depending on the number of common review keyworks, with higher thickness/weight meaning higher number of common keywords found.
The maximum degree in the network is 160
The minimum degree in the network is 1
Community detection
To investigate whether there are any groupings or clusters of hotels which are similar in terms of their special features or experiences (which get mentioned in users’ reviews), we have performed community detection.
For this, we compute and maximize the modularity score of each group of nodes through using the Louvain algorithm, which looks as how much more densely connected the nodes in a community are, compared to how connected the same nodes would be in a random network. The Louvain algorithm is an unsupervised clustering method, and allows finding of the best partition of nodes into communities from a full-scale graph.
4 communities have been found and visualised via Force Atlas Algorithmn and Plotly (interactive) below.
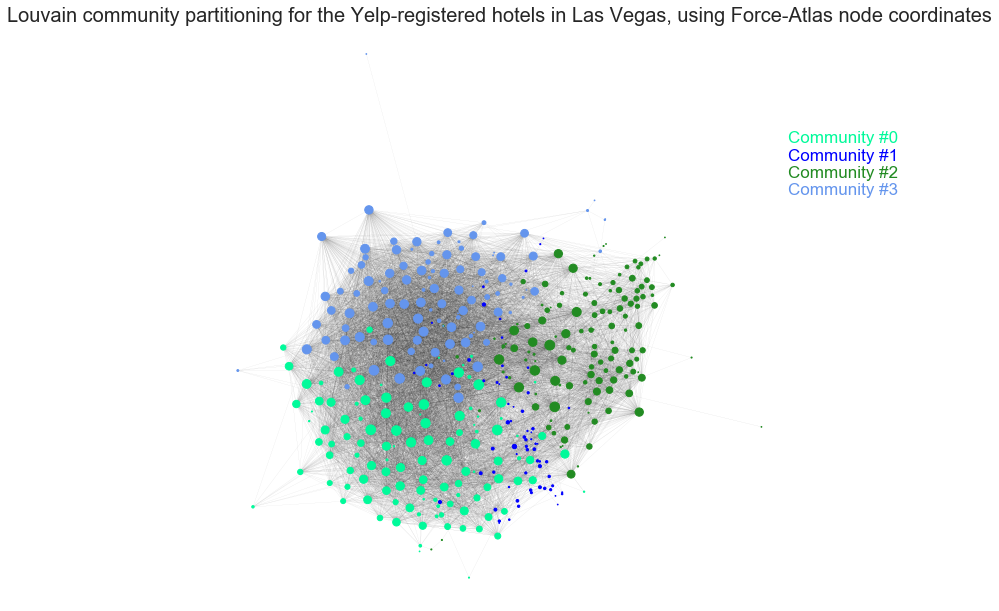
The visual representation shows a clear separation of the network plot into the 4 communities, which is a very nice result. It seems that there are 3 large communities of approximatively similar sizes, and one smaller community whose nodes are scattered across the graph due to their interaction with a wide variety of hotels located all across the graph.
The interactive visualization helps easily see that some of the very popular hotels are residing in Community 3, and that perhaps might have an important effect as to why they have been grouped together in the same community.
By hovering over the interactive graph, you will be able able to find which hotels are belonging to what community.
Community Wordclouds
We will take a look at what words characterize each community. It is relevant to see this, in order to understand if there is a trend for why certain hotels were grouped together, and also for understanding what kind of experiences do you normally get from hotels in that community.
We have aggregated all the reviews for each community independently, and calculate TF, IDF and TF-IDF scores upon their aggregated reviews.
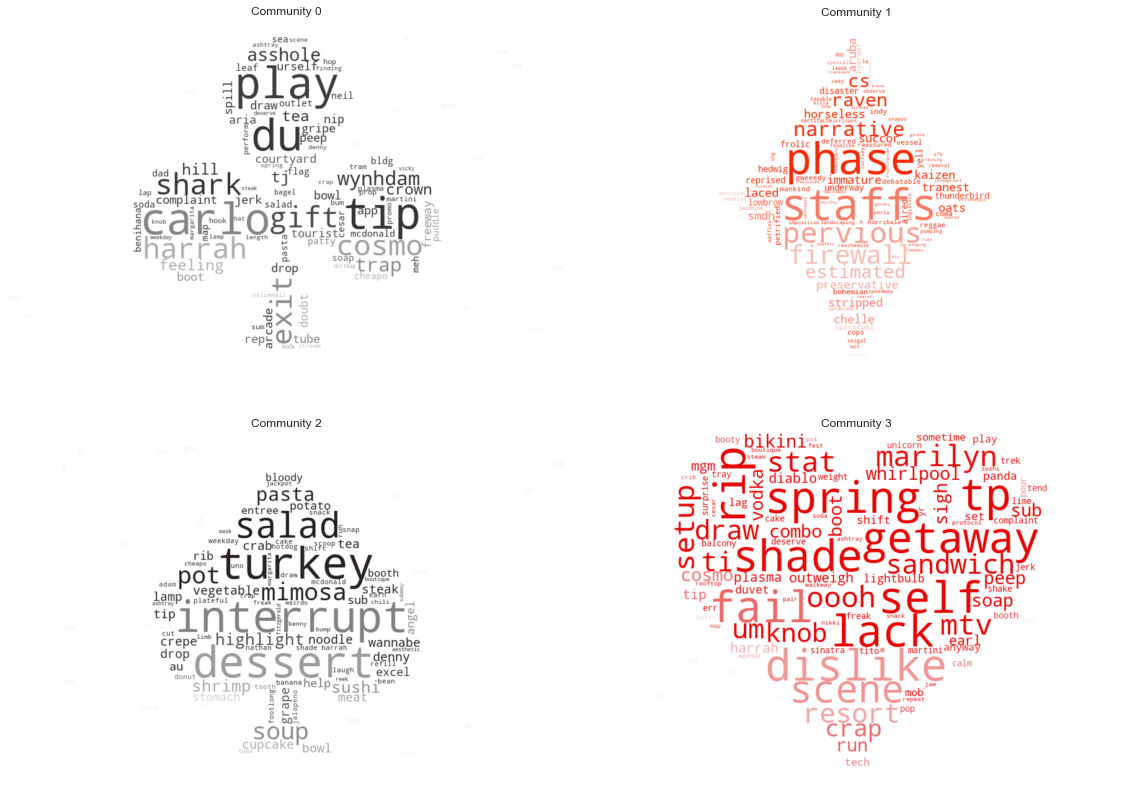
The community wordplot shows multiple very interesting and relevant findings:
Community 0 contains many keywords related to casino (‘tip’, ‘carlo’, ‘shark’, ‘booth’, etc.), as well as words related to the adult night life of Las Vegas.
Community 1 is the hardest one to pin-point. It seems that a central “theme” of the reviews belonging to hotels in this community is centered about the hotel staff, and words related to security. Later on, we will find that this community is also the one with the lowest sentiment score, which indicates that the comments regarding the staff here are not encouraging ones.
Community 2 (which we will later see that it is the happiest community) is related very strongly to food, desserts and fruits. The hotels grouped in this community seem to have the common specialization in exquisite and delicious culinary adventures.
Community 3 seems to have most words related to games, alcoholic drinking, as well as swear words, indicating that this community may be strongly involved with bar-hotels and the ones of a more “frivolous” nature.
Topic detection using LDA
Topic modelling is a tool for discovering hidden abstract semantic structures of texts, where Latent Dirichlet allocation (known as LDA) as an unsupervised learning method is one way of performing topic modelling.
Normally, LDA can be applied when we are trying to understand the latent topics in a large document collection without knowing what kind of topics there will be. The main idea of it is that each document can be described by a distribution of topics and each topic can be described by a distribution of words. Applying LDA on a bag of words will result in several generated topics, each of which is composed of a distribution of keywords.
After performing community detection using Louvain algorithm, the original dataset containing reviews has been split into 4 communities with their own wordclouds generated from reviews.
Since the Louvain algorithm has given us 4 communities, upon which we have plotted 4 wordclouds (each corresponding to a community), we decided to use topic modelling to check whether the results from a completely different unsupervised method will generate similar word structure patterns as the ones we have for the wordclouds. In order to understand if these two methods (LDA vs. wordclouds) find similar features in clustering words, we have set the input number of topics to 4 in the LDA model.
After using the LDA algorithm to find 4 large topics, it can be observed that the topics do indeed have a number of similar words shown in wordclouds (which is created through Louvain for partitioning and TF-IDF for scoring).
For example, topic 4 presented here is clearly showing words related to food and dessert, such as: ‘salad’, ‘steak’ or ‘buffet’, which is very similar to the words shown in the wordcloud for community 2.